BI Dashboards


Business Intelligence Dashboards That Turn Complex Data Into Clear, Actionable Insights for Better Business Decisions
At D Tech, we develop powerful BI Dashboard solutions that help businesses transform raw data into meaningful insights for smarter and faster decision-making. In today’s competitive environment, having access to data is not enough. Businesses need clear visibility into performance, operations, sales, finance, and customer trends in a way that is easy to understand and act on. Our BI Dashboards are designed to present critical information through interactive, real-time, and visually structured reports that support better planning, improved efficiency, and stronger business control.
Our BI Dashboard solutions are built to support growth, transparency, and data-driven decision-making across every level of your organization. At Dtech, we focus on creating dashboards that are not only visually engaging, but also practical, scalable, and aligned with real business needs. From strategy and design to implementation and support, we help businesses unlock the full value of their data and make confident decisions backed by clear and reliable insights.
Core BI Dashboard Solutions
We create dashboard solutions that bring important business data into one place, making it easier to track performance and identify improvement opportunities.
Business Intelligence Dashboards
Custom dashboards for management, sales, finance, operations and business teams to monitor important KPIs and performance indicators in a clear visual format.
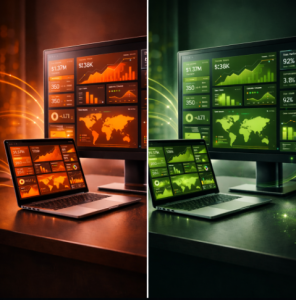
Data Visualization & Reporting
Convert spreadsheets, databases and system data into interactive charts, reports and visual insights that support faster decision-making.
What We Support
D Tech supports BI dashboard planning, data source connection, visualization design, reporting automation and ongoing improvements.
KPI Dashboard Design
Build dashboards around business goals, key metrics and department-specific performance indicators.
Data Source Integration
Connect data from spreadsheets, databases, ERP systems, CRM systems and other business platforms.
Sales & Finance Reports
Track revenue, costs, targets, profit trends, sales performance and financial summaries.
Operational Dashboards
Monitor workflow efficiency, productivity, service performance and operational bottlenecks.
Real-Time Reporting
Provide up-to-date dashboard views so teams can respond faster to business changes.
Dashboard Support
Ongoing dashboard updates, data corrections, report improvements and user guidance.
Why Choose D Tech for BI Dashboards?
Businesses often collect large amounts of data but struggle to use it effectively. D Tech helps convert business data into practical dashboards that clearly show performance, trends, risks and opportunities. This helps management teams make decisions based on real insights instead of assumptions.
Our BI Dashboard Development Process
A clear process to understand your business data, define KPIs, design dashboards and support long-term reporting improvements.
Requirement Review
We understand your business goals, reporting needs, data sources and key performance indicators.
Data Planning
We review available data, prepare dashboard structure and plan the right reporting approach.
Dashboard Design
We create visual dashboards with charts, metrics, filters and clear reporting layouts.
Support & Improve
We provide dashboard updates, report improvements and support as business needs change.
Make Smarter Decisions with BI Dashboards
Partner with D Tech to turn your business data into clear, actionable dashboards that help improve visibility, reporting and decision-making.
Get StartedWhat They Say
Hear from our valued customers about their experience, satisfaction, and trust in our service.
Google Rating
Excellent service and professional support. The team was very helpful, responsive, and delivered the work with great attention to detail.
N. E. R. Wickramasinghe
CustomerVery reliable and friendly service. They understood our requirements clearly and provided a smooth experience from start to finish.
Chaminda Perera
CustomerWe are happy with the overall quality of work. The communication was clear, and the final outcome matched our expectations.
Dilani Fernando
CustomerEmpower Your Business with Smart IT Solutions – Let’s Build the Future Together!
Frequently asked questions
Answers to the most frequently asked questions.
For how many years has D Tech been in the IT industry?
D Tech has over 10 years of experience delivering innovative IT solutions to businesses across Sri Lanka
What industries do you cater to?
We serve a wide range of industries, including retail, education, healthcare, manufacturing, logistics, hospitality, and more.
Can D Tech help with digital transformation?
Yes, we excel at digital transformation by blending modern software, cloud solutions, and smart web strategies to make your business flourish in the digital world.
How do I get a quote for your services?
You can reach out to us via our contact form at dtech.lk, email, or phone, and we’ll provide a free consultation followed by a tailored quote.